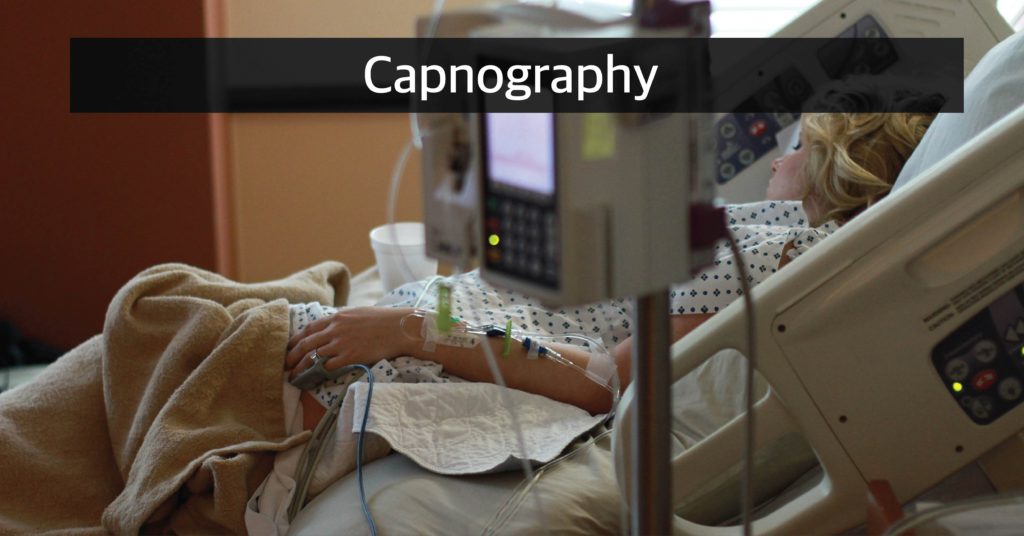

What is Capnography?
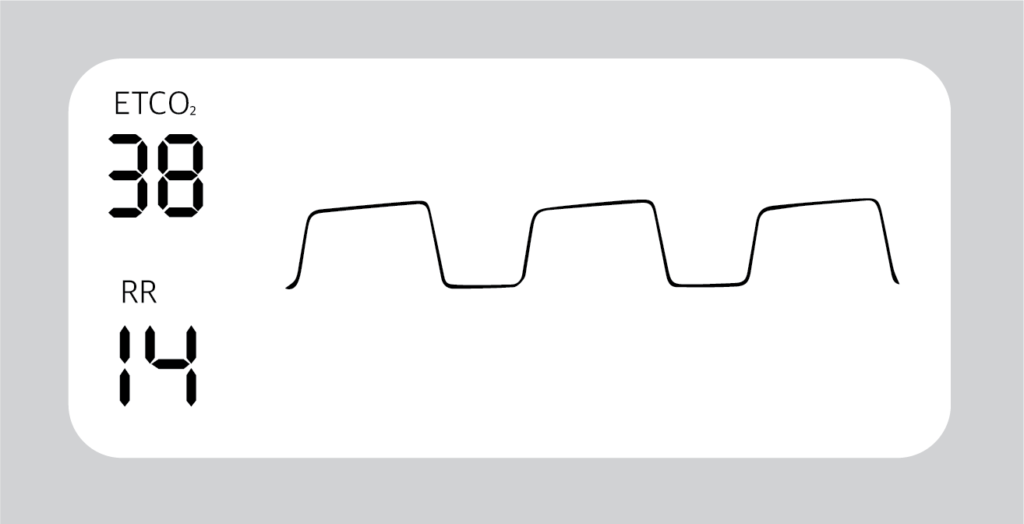
Capnography is a clinical procedure used for the measurement of CO2 levels in respired air at the end of expiration (End tidal CO2). In Capnography the results are displayed in graphic and numerical form.
Graphic form gives more details to diagnose and assess the ventilation of the patient.
What is Capnometry?
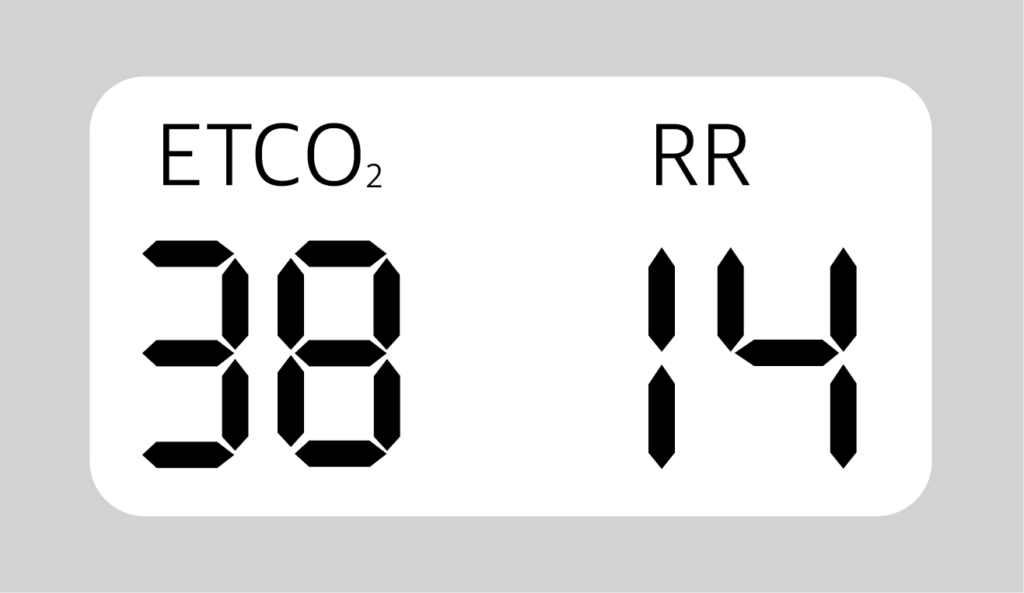
Capnometry is also used to measure End Tidal CO2 but gives results only in numerical form. (only in numbers and no graphic form)
How Capnography Works?
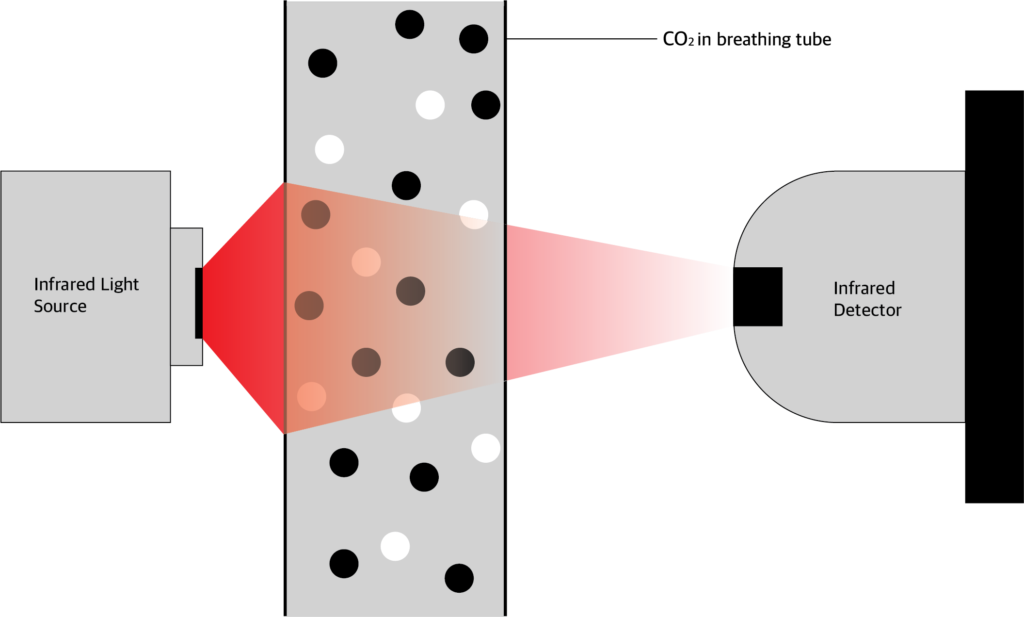
Carbon dioxide absorbs infrared light energy. The amount of infrared light absorbed depends on the CO2 concentration. In ccapnography device, CO2 is allowed to pass through infrared light.
The amount of light absorbed is calculated by comparing the amount of infrared light send from the source and the amount received by the photo detector.
From this the CO2 pressure is calculated and values given in graphic and numerical form.
What is the normal ETCO2 values?
Normal ETCO2 value is between 35 to 45 mmHg.
Normal respiratory rate is 14/min.
What are the indications of Capnography?
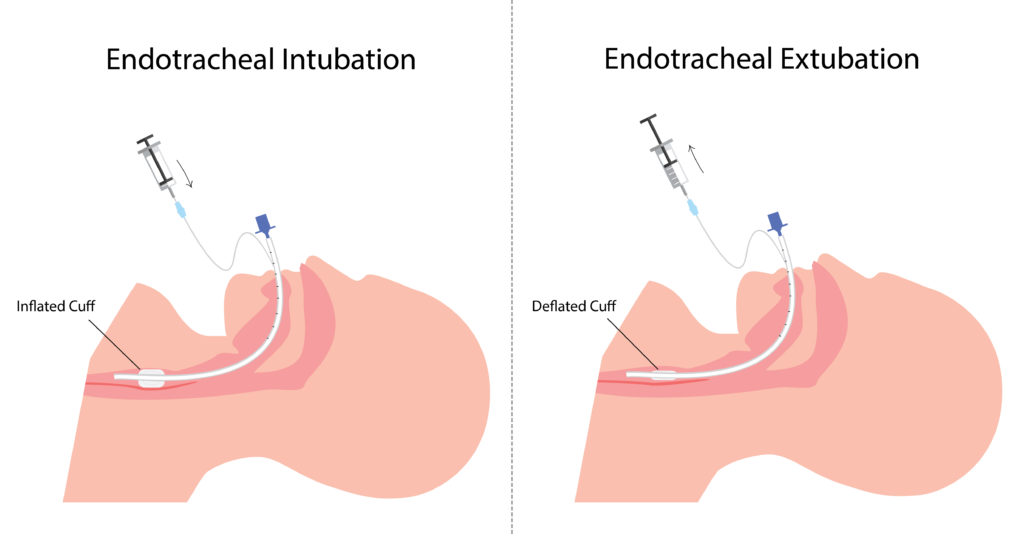
- Verification of artificial airway placement (intubated paient)
- Assessment of pulmonary circulation and respiratory status
- Assess V/Q relationship
- assess dead space and tidal volume ratio
- Optimization of mechanical ventilation
- Monitoring carbon dioxide elimination
- Screening patients for pulmonary embolism
- Assess the efficiency of ventilator support (PaCO2 – PETCO2)
What are the contraindications of capnography?
- There are no absolute contraindications to capnography in mechanical ventilator parients.
What are the types of Capnography?
- Mainstream
- Side stream
Mainstream
The mainstream analysier chamber placed between the endotracheal tube and the ventilator circuit.
Advantages:
- Sensor placed in breathin circuit.
- Fast response(crisp waveform)
- Short lag time
- No sample of gas removed to reduce tidal volume
Disadvantages:
- Required frequent calibration
- Secretions and humidity can block sensor’s window
- Difficult to use in non intubated patient
- Bulky sensor in airway
- Reusable adaptors require cleaning and sterilization
Side Stream
The side stream sensor is placed in the main unit and not in the airway. CO2 is aspirated through a sampling tube, connected to a T piece adapter.
Advantages:
- No bulk sensor or heater in the breathing circuit
- Disposable sampling line
- Ability to use with non intubated patient
Disadvantage:
- Secretions can block sampling tube
- Sample flow may decrease the tidal volume
- Lag time between CO2 change and measurement
- Slow response to CO2 change
- Frequent calibration is required
How to interpret the waves of Capnography?
Normal Capnogram:
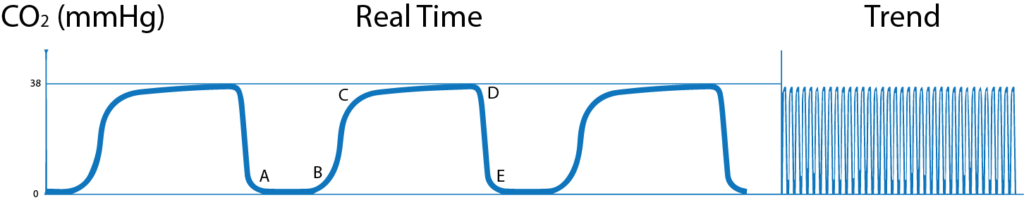
A-B: CO2 level is 0 mmHg. This shows the CO2 free air from dead space (Both anatomical and apparatus dead space)
B-C: In this phase, alveolar gas mixes with dead space gas, so there is steep increase in expired PCO2.
C-D: this phase is called Alveolar Plateau. Here as the CO2 rich gas is exhaled the alveoli becomes smaller and the concentration of CO2 increases towards
D: End of expiration showing End Tidal CO2.
D-E: in this phase inspiration starts and fresh CO2 free air is inhaled and so the PCO2 falls to 0.
Trend Graph: Shows changes in one hour.
Abnormal Capnogram:
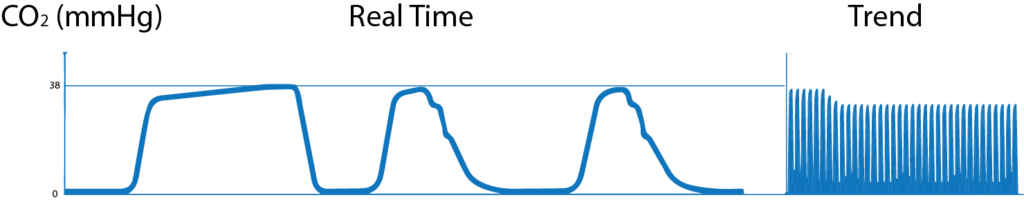
1. Gradual increase in ETCO2
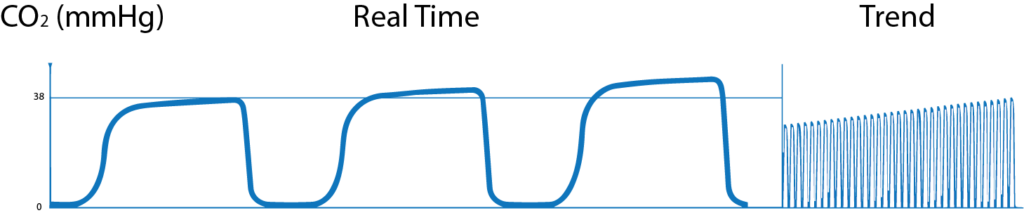
- Hypoventilation (Decreased Respiratory rate) and decreased tidal volume.,
- Increased metabolic rate, increased muscular activity,
- Malignant Hyperthermia (sudden raise in temperature)
- Good response to bronchodilators.
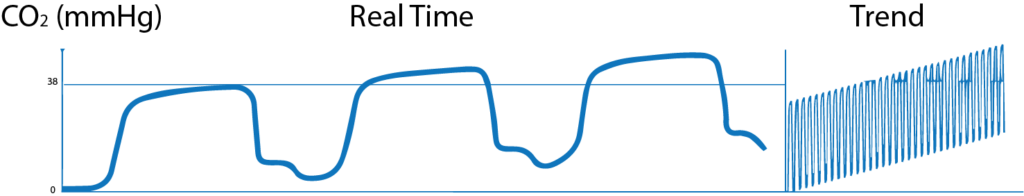
2. Gradual decrease in ETCO2
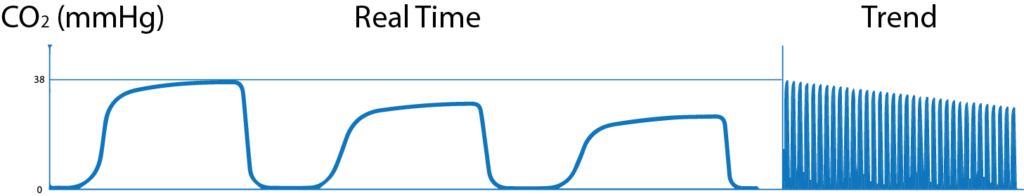
- Hyperventilation (increased respiratory rate) and increased tidal volume,
- Decreased metabolic rate, decreased muscular activity,
- Hypothermia (drop in temperature),
- Pulmonary embolism.
3. Airway obstruction
- Obstruction in breathing circuit,
- Foreign body in patient’s upper airway,
- Blocked or kinked artificial airway,
- Bronchospasm,
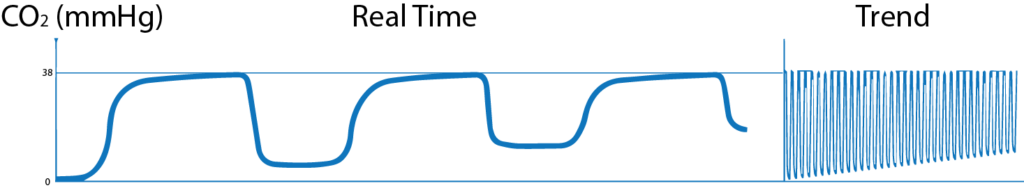
4. Cleft in wave
- When the action of the muscle relaxant, given to the patients subsides and when spontaneous breathing starts, cleft appears in plateau of the wave.
5. Transient wave form

- When the endotracheal tube is in the oesophagus, no CO2 waves are seen or small transient waves are seen.
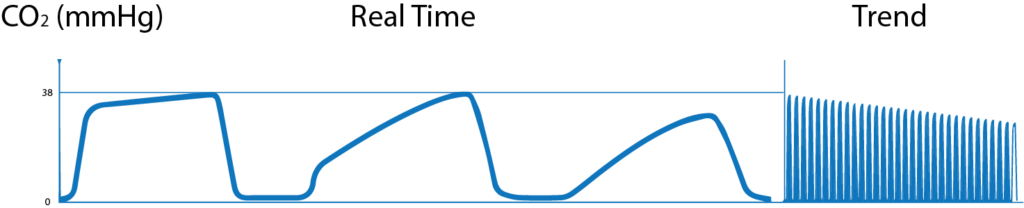
6. Distorted downward slope
- Deflated or leaking tracheotomy or endotracheal tube and small artificial airway can produce distorted downward wave.
7. Base line elevated and abnormal descending limb
- Fault in exhalation valve of the ventilator
- Patient re breathing exhaled air can produce waves with base line elevation and abnormal descending limb.
8. Elevation of base line with corresponding increase in ETCO2
- Faulty expiratory valve
- Partial rebreathing
- Insufficient expiratory time
- Malfunction of CO2 absorber system